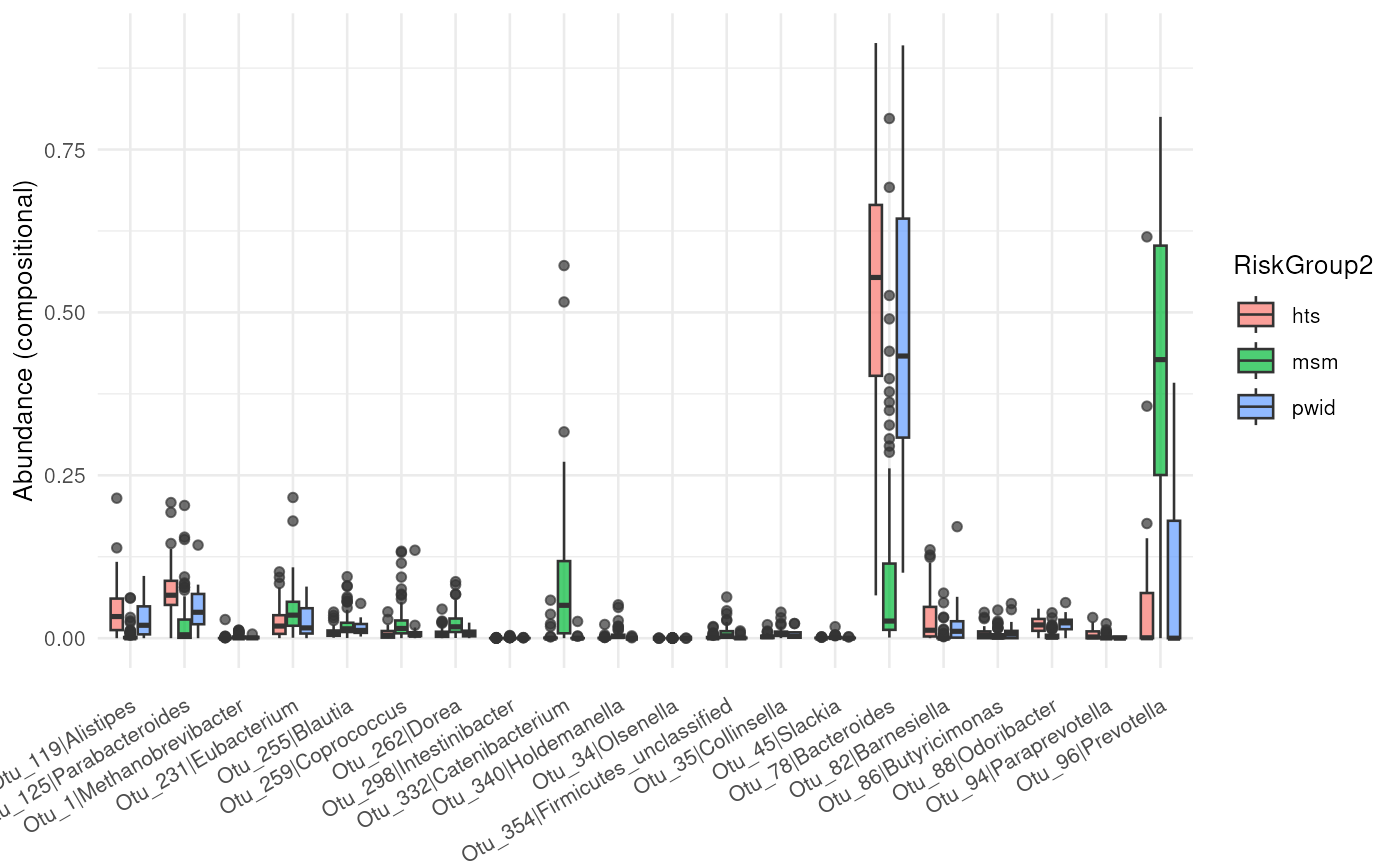
Plot observed abundances of selected analysis taxa
Arguments
- rec
A prepped
Recipeobject.- taxa_ids
Character vector of analysis taxon IDs to plot. Explicit IDs bypass significance-based selection and are not truncated by
top_n.- type
Character vector indicating the type of the result. Options: c("boxplot", "heatmap").
- transform
Transformation to apply. The options include: 'compositional' (ie relative abundance), 'Z', 'log10', 'log10p', 'hellinger', 'identity', 'clr', 'alr', or any method from the vegan::decostand function. If the value is NULL, no normalization is applied and works with the raw counts.
- scale
Scaling constant for the abundance values when transform = "scale".
- top_n
Maximum number of automatically selected taxa. Default: 20.
- target
Modeled target used for annotations. Required when a modeled recipe contains more than one target.
- contrast_id
Modeled contrast used for automatic taxon selection. Required when
taxa_ids = NULLand more than one contrast is available.- steps
Character vector of executed DA step IDs used for automatic selection. Use a single ID to plot that configured method's discoveries. Defaults to all executed DA steps.
- selection
Automatic selection rule:
"shared"requires a significant result with the same contrast and effect direction in every selected step;"union"includes discoveries from any selected step. No fallback to a different rule is performed when the requested selection is empty.
Value
ggplot2 or HeatmapList, or invisible NULL with an informational
message when automatic selection finds no significant taxa.
Details
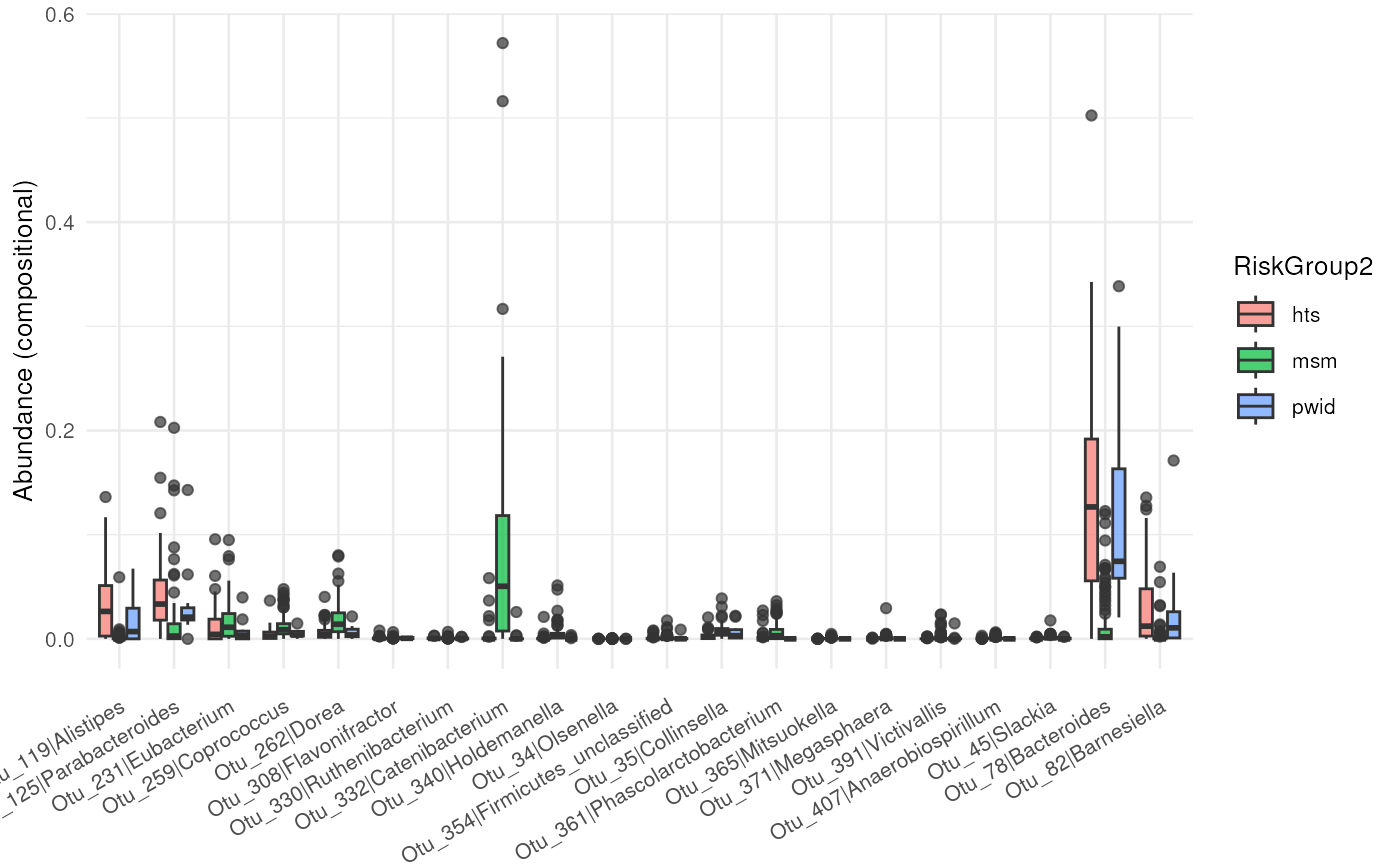
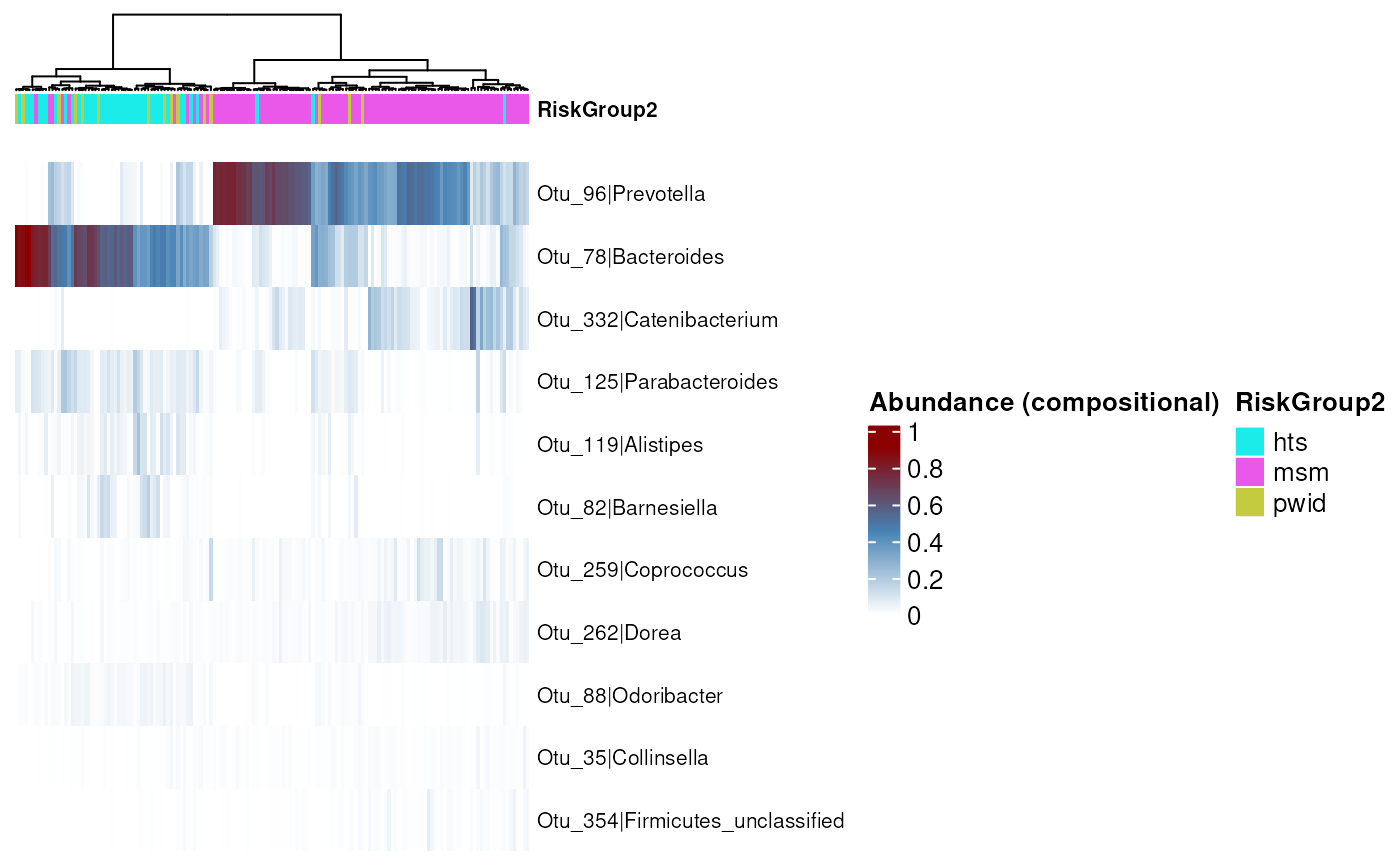
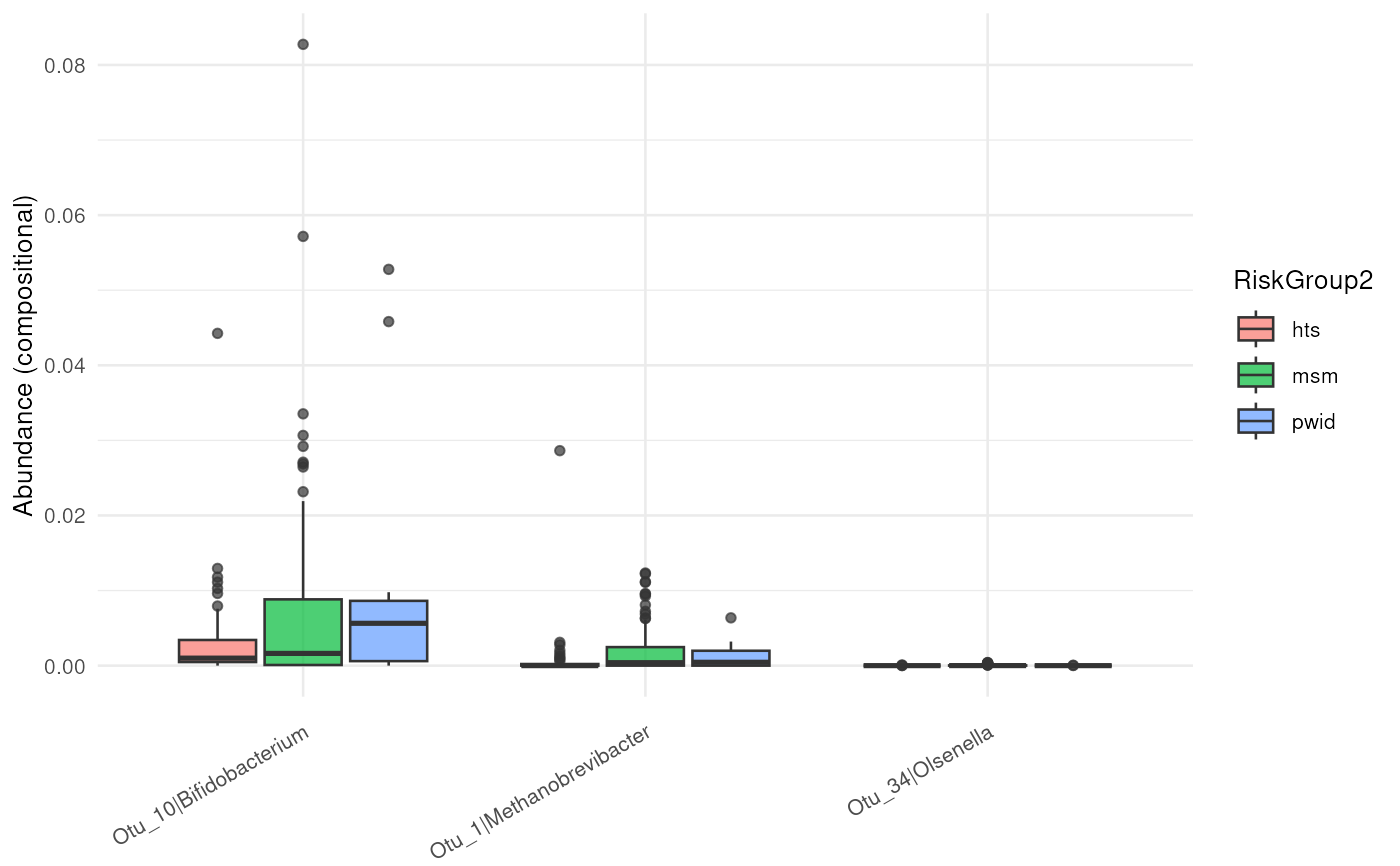
Abundances use the shared taxonomic analysis view, before any method-specific filtering or transformation. The plotted values are observed abundances, not covariate-adjusted predictions. Transformations use all analysis taxa before the display is restricted to selected IDs. Automatic selections are ordered by decreasing support across selected steps, with ties resolved by analysis taxon order, not by pooled effects.
Examples
data(test_prep_rec)
results <- tidy_results(test_prep_rec)
contrast_id <- results$contrast_id[[1]]
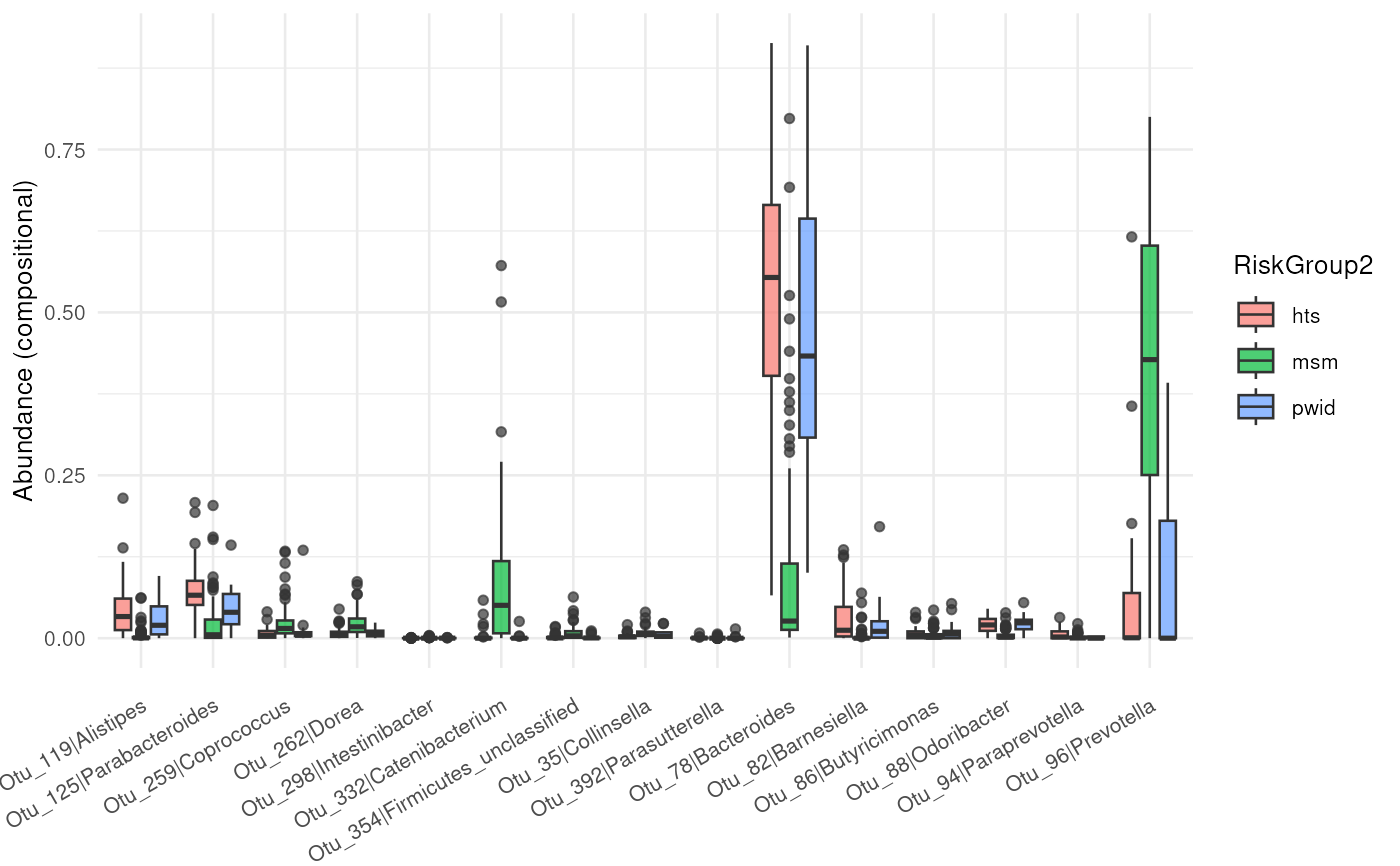
## Boxplots of taxa detected by all methods
abundance_plt(test_prep_rec, contrast_id = contrast_id)
#> You have inserted a phyloseq object. The phyloseq-based methods will be deprecated. We recommend switching to the (Tree)SummarizedExperiment framework and mia R/Bioconductor package.
 ## Display the same abundances as a heatmap
if (requireNamespace("ComplexHeatmap", quietly = TRUE) &&
requireNamespace("gplots", quietly = TRUE)) {
abundance_plt(test_prep_rec, type = "heatmap", contrast_id = contrast_id)
}
 ## Select taxa explicitly
taxa_ids <- head(unique(results$taxa_id), 3)
abundance_plt(test_prep_rec, taxa_ids = taxa_ids)
 ## Discoveries from one configured method, without requiring agreement
method_id <- steps_ids(test_prep_rec, "da")[[1]]
abundance_plt(test_prep_rec, steps = method_id, contrast_id = contrast_id)
 ## Union of discoveries from the executed methods
abundance_plt(test_prep_rec, selection = "union", contrast_id = contrast_id)