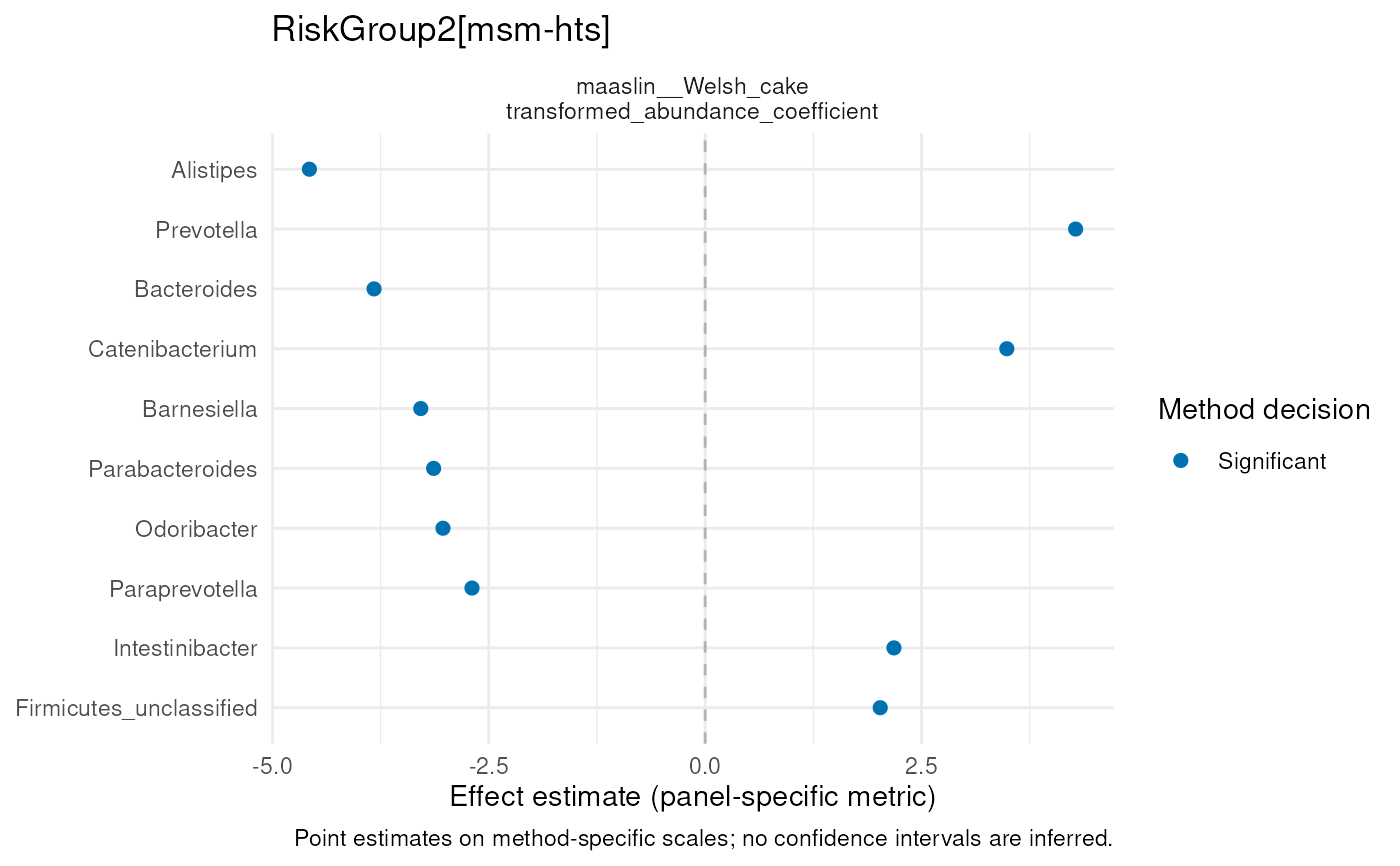
Displays point estimates returned by the selected differential-abundance steps for one contrast. Each configured step and effect metric has its own panel and axis scales; effects are not pooled or standardized across methods. Colours retain the originating step's significance decision rather than recomputing it from a common p-value threshold. Confidence intervals are not inferred from the common result contract.
Usage
effect_plt(
  rec,
  taxa_ids = NULL,
  steps = steps_ids(rec, "da"),
  target = NULL,
  contrast_id = NULL,
  top_n = 20
)
Arguments
- rec
A PrepRecipe object.
- taxa_ids
Optional character vector of taxon identifiers to display. When supplied, all finite returned effects for these identifiers are included and
top_nis not applied. Taxa with identical names remain separate units and are labelled with their identifiers when needed.- steps
Character vector of executed differential-abundance step IDs. By default, all executed DA steps are included.
- target
Optional modeled target to include.
- contrast_id
Optional contrast identifier. This is required when more than one contrast remains after selecting
target.- top_n
Maximum number of taxa selected independently in each step and effect-metric panel when
taxa_idsisNULL. Taxa are ranked by decreasing absolute finite effect within that panel, with taxon ID as a tie-breaker. This is a display selection, not a significance or consensus rule.
Value
An editable ggplot2 object. Returns invisible NULL with an
informational message when no finite effects are available. Returned
nonfinite effects are omitted; absent result rows are never
interpreted as zero effects or nonsignificant findings.
Examples
data(test_prep_rec)
results <- tidy_results(test_prep_rec)
effect_plt(
  test_prep_rec,
  steps = results$step_id[[1]],
  contrast_id = results$contrast_id[[1]],
  top_n = 10
)